
The internal resistance provides valuable information about a battery as high reading hints at end-of-life. This is especially true with nickel-based systems. Resistance measurement is not the only performance indicator as the value between batches of lead acid batteries can vary by 5–10 percent, especially with stationary units. Because of this wide tolerance, the resistance method works best when comparing the readings of a given battery from birth to retirement. Service crews are asked to take a snapshot of each cell or monoblock at time of installation and then measure the subtle changes as the cells age.
There is a notion that internal resistance is related to capacity, but this is false. The resistance of modern lead acid and lithium-ion batteries stays flat through most of the service life. Better electrolyte additives have reduced internal corrosion issues that affect the resistance. This corrosion is also known as parasitic reactions on the electrolyte and electrodes. Figure 1 shows capacity fade with cycling in relation to the internal resistance of Li-ion cells.
.jpg)
Resistance does not reveal the state-of-health of a battery and often stays flat with use and aging.
Cycle test on Li-ion batteries at 1C:
- Charge: 1,500mA to 4.2V, 25°C
- Discharge: 1,500 to 2.75V, 25°C
What Is Impedance?
Before exploring the different methods of measuring the internal resistance of a battery, let’s examine what electrical resistance means and understand the difference between pure resistance (R) and impedance (Z). R is pure resistance and Z includes reactive elements such as coils and capacitors. Both readings are obtained in ohms (Ω), a measurement that goes back to the German physicist Georg Simon Ohm, who lived from 1798 to 1854. (One ohm produces a voltage drop of 1V with a current of 1A.) The electric conductivity is also measured in siemens (s) that is reciprocal to ohmic values.
The electrical resistance of a pure load, such as a heating element, has no reactance. Voltage and current flow in unison and there is no advancing or trailing phase. The ohmic resistance is the same with direct current (DC) and alternating current (AC). The power factor (pf) is 1, providing the most accurate metering of the power consumed.
Most electrical loads are reactive and consist of capacitive reactance (capacitor) and inductive reactance (coil). The capacitive reactance decreases with higher frequency while the inductive reactance increases. An analogy of inductive reactance is an oil damper that stiffens when applying a fast back-and-forth action.
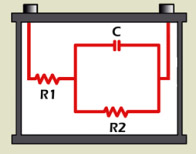
A battery has resistance, capacitance and inductance, and the term impedance includes all three in one model. Impedance can best be illustrated with the Randles model (Figure 2) that comprises resistors R1 and R2 as well as capacitor C. The inductive reactance is commonly omitted because it plays a negligible role in a battery, especially at a low frequency.
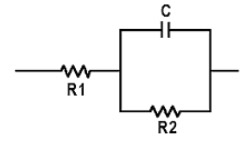
The overall battery resistance consists of ohmic resistance, as well as inductive and capacitive reactance. The diagram and electrical values differ for every battery.
- R1 = Internal resistant; R2 = Charge transfer
- C1 = Double layer capacitor
Measuring the battery by resistance is almost as old as the battery itself and several methods have developed over time, all of which are still in use.
DC Load Method
The ohmic measurement is one of the oldest and most reliable test methods. The battery receives a brief discharge for a second or longer. The load current for a small battery is 1A or less; for a starter battery it might be 50A or more. A voltmeter measures the open circuit voltage (OCV) with no load, followed by the second reading with a load; Ohm’s law calculates the resistance value (voltage difference divided by current equals resistance).
DC load measurements work well to check large stationary batteries, and the ohmic readings of the device are very accurate and repeatable. High-end test instruments claim resistance readings in the 10 micro-ohm range. Many garages use the carbon pile to measure starter batteries and an experienced mechanic gets a reasonably good assessment of the battery.
The DC load method has limitations in that it blends R1 and R2 of the Randles model into one combined resistor and ignores the capacitor (see Figure 3). “C” is an important component of a battery that represents 1.5 farads per 100Ah capacity. In essence, the DC method sees the battery as a resistor and can only provide ohmic references. In addition, the DC load method gets similar readings from a good battery that is partially charged and a marginal battery that is fully charged. State-of-charge and capacity estimations are not possible.
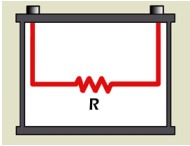
The true integrity of the Randles model cannot be seen. R1 and R2 appear as one ohmic value.
The two-tier DC load method offers an alternative method by applying two sequential discharge loads of different currents and time durations. The battery first discharges at a low current for 10 seconds, followed by a higher current for 3 seconds (see Figure 4); the Ohm’s law calculates the resistance values. Evaluating the voltage signature under the two load conditions offers additional information about the battery, but the values are strictly resistive and do not reveal SoC or capacity estimations. The load test is the preferred method for batteries that power DC loads.
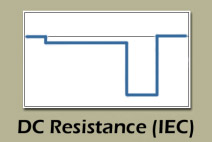
The two-tier DC load follows the IEC 61951-1:2005 standards and provides lifelike test conditions for many DC battery applications.
AC Conductance
Conductance measurement to evaluate starter batteries was first reported by Keith Champlin in 1975 by demonstrating a linear correlation between load test and conductance. When injecting a frequency of about 90 hertz, capacitive and inductive reactance converge with a 70–90Ah lead acid battery, resulting in a negligible voltage lag that minimizes the reactance. (This frequency rises with a smaller battery and drops with a large pack.) AC conductance meters are commonly used in car garages to measure CCA. The single-frequency method (Figure 5) sees the components of the Randles model as one complex impedance called the modulus of Z.
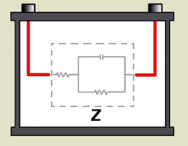
The individual components of the Randles model are molten together and cannot be distinguished.
The 1,000-hertz (Hz) ohm test is another common method. A 1,000Hz signal excites the battery and Ohm’s law calculates the resistance. Note that the AC method shows different values to the DC method when measuring a reactive resistance, and both readings are correct.
For example, Li-ion in an 18650 cell produces about 36mOhm with a 1,000Hz AC signal and roughly 110mOhm with a DC load. Since both readings are valid, yet far apart, the user must consider the application. The pulse DC load method provides valuable readings for a DC application such as a heating element or an incandescent light, while the 1,000Hz method better reflects the performance requirements of a digital load, such as portable computing and mobile phones that rely to a large extent on the capacitive characteristics of a battery. Figure illustrates the 1,000Hz-method. (See also Table 2 in BU-802a: How does Rising Internal Resistance affect Performance?)
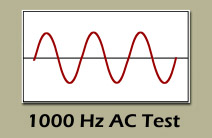
The 1000-hertz provides reactive resistance readings. This has been the preferred method for taking impedance snapshots of batteries powering digital devices.
Electrochemical Impedance Spectroscopy (EIS)
Research laboratories have been using EIS for many years to evaluate battery characteristics. High equipment cost, slow test times and the need for trained professionals to decipher the large volume of data have limited this technology to laboratory environments. EIS reads R1, R2 and C values in the Randles model (Figure 7); however, correlating the data into CCA and capacity estimations requires complex modeling(See BU-904: How to Measure Capacity)
R1, R2 and C are measured separately, which enables state-of-charge and capacity measurements.
References
[1] Courtesy of Cadex
Last Updated: 4-Nov-2021

Batteries In A Portable World
Comments
Looking for comments from the previous website?
Comments from the previous website are not compatible with our new commenting system but we have preserved them so our users can still reference and make use the information in them.
Show Old Comments
On August 28, 2019, Chagai wrote:
Hi, In Lithium-Ion cells: 1) Does the internal resistance decrease or increase when the SoC/Open Circuit Voltage decreases? 2) Is there a reason for this? 3) At higher temperatures, the internal resistance decreases. But is there more then one process (chemical / physical) happening at the same time? Are they both in the same direction? or acting in opposite ways? for example: current drawn from the battery --> higher temperatures --> lower internal RES. but also: current drawn from the battery --> dropping voltage --> ?higher RES? -One is stronger than the other and thus 'wins' ? thanks!
On July 2, 2019, Petar Muhovski wrote:
Hello! Dear Sirs, my question is: - haw many must to be internal resistance for traction element 8PzS920Ah? Thank you in advance! Regards, Petar Muhovski Marketing Director BRS Balkans Sofia, Bulgaria 1a Kukush str. mobile: +359 887 720 533 email: pmuhovski@brsbalkans.com www.brsbalkans.com
On March 15, 2019, may wrote:
Thanks for these notes. I am bit puzzled by this statement "Resistance does not reveal the state-of-health of a battery and often stays flat with use and aging." but the definition of SoH points to using the internal resistance as part of the measurement to reveal the State of Health of the battery. Hope to clarify on this. Thanks,
On October 26, 2018, Paul Lingane wrote:
I am wondering how internal resistance changes with age in primary alkaline cells. I want to store my device on the shelf for several years and then discharge at a C/5 rate. The question is how much capacity is available? If the IR has risen substantially over that time then it may limit my available energy more than a simple loss of total capacity (which is normally measured at a very low discharge rate). Any info or citations to the literature would be appreciated.
On October 10, 2018, sundari wrote:
can we find out Lithium ion battery model parameters values(R1,R2,R3 and C1,C2,C3) from battery output voltage and current.please someone help me.My guide assigned this work to me. Thanks in advance.
On March 10, 2018, Eric jabouin wrote:
Many people in my country Haiti used Battery Backup
On December 25, 2017, Anddre Balogh wrote:
.As mentioned before, have worked with rechargeable batteries of all chemistry for over 45 years,(received a BMS patent ) In my humble opinion , when ever I am faced with testing a battery of any chemistry or number of cells, knowing what device the battery pack will power, and expected current drain . Always first reach for my faithful Hewlett Packard 4328A milliohmmeter (nothing comparable in the price/performance/dependability for over 40 years) . It is a 1 Khz AC impedance analog meter able to measure the impedance of the battery up to 150VDC ($200-$500 on e-bay) After that will measure the voltage (assuming that no cell are shorted ) With volt and impedance, it is simple math to determine the following 3 important parameters,1) max short circuit current available from the battery, 2) peak max running current, 3) suggested discharged current,I highly recommend that you follow the manufacturer specification sheet , the reliable ones will have a impedance figures (measured at 1 Khz) ,those that do not show a figure , strongly recommend staying away from . With the measured impedance , divide the normal operating voltage of the battery by 2 X impedance figures.Example , 6 volts (5 NiCad cells) impedance of 20 milliohms (0.020 Ohms ) X2 = 0.040 , therefore 6 /0.04 = 150 Amps this is the max you can get out of the pack by shorting out ( not recommended )Taking this 150 Amp dividing it by 20-100 factor should give a relative discharge current capability from that pack, so this pack should able to deliver 1.5 amps continuously with 7.5 peak current without much stress. It is complete waste of time to measure the voltage without a impedance figure . Working with eneloop AA cell ,found cells with 20 milliohm and some 2-10 ohms impedance ( yes over 100-500 range ) with identical > 1.350 voltage readings. The 20 milliohm cell will power almost anything (>2-3 A peak current ) the 2 ohms cell will do fine when used powering a wall clock (0.010 A ) In my humble opinion the impedance figure is of more importance than voltage or A/H capacity (can have a monster battery pack but if it has high impedance the energy cannot be taken out or replaced )Impedance is directly related to loss or heat generation in battery ,so the lower impedance mean less heat , which translate into longer battery life .... Those are my 2 cents regarding impedance,So first and foremost measure impedance ... .
On June 3, 2017, Lloyd Johnson wrote:
If the internal resistance is that much higher that a known good quality battery, then I would say those batteries are no longer usable. Not all battery types show a steady increase of impedance over their life. I am most familiar with NIMH batteries and they do show a steady increase of resistance with life. NIMH packs of 6 18650 size cells in series start out with resistance of 150-250 milliohms and we consider them at end of life when they reach 800 milliohms. We test at 90 Hz.
On June 1, 2017, Nikos B. wrote:
I have a dc turnigy smart charger which has a program to measure internal resistance of batteries.I have many 18650 laptop cells that shows measurements from 130 to 230 (if i remember correct).This means that the batteries are unusable?I think it is to high.You say on the article that reaistance is getting higher by usage but how can be so high usually most brands like samsung,panasonic,lg,etc have <50.
On May 14, 2017, Anita wrote:
To Simon battery testers are battery testers! To test internal resistance you need to load the battery at least to Ah rating If it is something like a golf cart, a wheel chair, scooter… If it’s a cranking battery, load to 10 times the Ah The 2 tier (fig 4) is far better way to measure internal resistance
On May 14, 2017, Anita wrote:
To Rabeea Is there a standard? from where can i get that? the standard is when the battery routinely no longer does the job, it is considered at end of life for example, an automobile battery may no longer start the vehicle engine, but the very same battery may still give many years of service in a UPS standby system
On May 7, 2017, Frățilă Ștefan wrote:
In a substation of power transition or distribution network commonly is only one lead stationary battery. Is there, in North America power networks, one or many (different) systems to control the continuity of that battery in currently functioning? Here, in Romania, there is not such a system and, sometimes, protections remain without operating voltage with very bad results. Thank you for listening me! Sorry for my bad English, I am, of course, a native Romanian. Eng. Șt. Frățilă
On May 4, 2017, PicO_Student wrote:
Hi, Is it possible to measure someway the capacity of a (starter) lead acid battery? i need it for my study about battery. Thanks a lot.
On March 19, 2017, John C. wrote:
Excellent article and excellent site. I will follow this up with a question, which I will do via email.
On February 25, 2017, Pam wrote:
4 flooded maint free calcium in 18 wheeler. Started smelling rotten eggs. Did a maintence. One of strongest battery 13v 1250 amps @ 12.3. When charging will not quit charging. Other batteries at ambient temp. Problem battery 20° higher. Any ideas? 2) betteries in parallel 12v seems I can check individual battery's still connected to buss bar. But more accurate with buss bar off? This site has taught me lots n lots. Thank you all
On February 1, 2017, Lynnette Reese wrote:
Fluke has Battery analyzers (BTL10, for example) and a white paper on how to test internal resistance. The Fluke paper also supports the "flat resistance until the end of life" statement made in this article, titled: "Maintaining backup battery systems for maximum usage and reliability," which recommends testing the battery at installation and periodically thereafter. As a battery nears the end of life, the internal resistance shoots up and capacity also decreases. Prior to that, internal resistance is flat, so there is no way to determine mid-life how much capacity/life is left in a battery using internal resistance as a guide; not until it starts to fail.
On January 31, 2017, EE-mom wrote:
@Andrew. You are correct. This is a typo. The author meant to say "Combining resistance and reactance is known as impedance." I can't say that this article really helped me any, either. IMHO, the author should contact the commenters and add some practical information.
On January 31, 2017, Andrew wrote:
Combining resistance and impedance is known as reactance. Is this a typo? Combining resistance and reactance results in impedance. When you combine resistance and impedance you get an impedance. When you combine reactance and impedance you get an impedance. You don't get reactance because reactance doesn't have a purely-resistive component; impedance does.
On November 7, 2016, Rabeea wrote:
Hey I need help with the following: I am using a battery analyzer for measuring battery voltage, resistance and chemical properties. Is there an absolute value of resistance for a 12 V battery at which i can declare the battery healthy or unhealthy? Is there a standard? from where can i get that?
On October 26, 2016, Simon wrote:
I have just measured the internal resistance of a 12v 44Ah 440En flooded car battery using a 68 Ohm resistor (10W) the figures I got where: Battery voltage: 12.70 V Resistor valve: 68 Ω Current in circuit: 0.185 A Voltage across resistor: 12.61 V I've substitute the two voltage readings: 12.70 – 12.61 = 0.09 V And divide this by the current: 0.09 / 0.185 = 0.486 Ω Is this correct ? If I may ask a second question when a battery tester says 'dead cell' is this just a dramatic way of representing the data in order to sell a new battery. Clearly the battery tester can't test each cell. I understand that each cell is aprox 2.1v so if the inital battery voltage is circa 10.6v then is a fair call. But I work at the roadside and test batteries in all kinds of SOC and voltage and oftern retest batteries that had a 'dead cell' result and now they pass or fail but no dead cell comments. Is there a way of spotting a dead cell with any of the resistance tests etc? Many thanks
On October 25, 2016, Chinh wrote:
I want to Measure Internal Resistance of the battery 18560 i have a system with 500Pc . How i can Measure Internal Resistance of per cell ???
On May 30, 2016, Muthu pandi wrote:
I am basically mechanical back ground. Last week i attend an interview. The question was like this. How to know the single battery condition in battery bank. How to check...Pls give u r answer
On February 29, 2016, Paul Bacina wrote:
Possible typo. From figure 5: Are the values "molten together" or are they "modeled together"? AC conductance method Figure 5: AC conductance method The individual components of the Randles model are molten together and cannot be distinguished.
On February 16, 2016, parsuram upadhyay wrote:
how to checked the resistance test in power plant . we have 18 battery 330am 12 volt connected in series get 110 volt . please suggest good method to use : resistance test and capacity test if there is any measuring equipment for resistance test please provide detail specification
On December 30, 2015, John Rajan wrote:
Measurement of internal resistance / impedance will be useless without any previous records. I mean , the previous record of resistance / impedances required to compare the present value . I am correct ?
On November 4, 2015, victor juarez wrote:
Andre Balogh is correct. Wuld be more ealistic to compare the discharge chart of tested battery with experimental results at 1C .-1C is the nominal Ah capaity- taking care of time to measure Wh. The nominal energy density of common Lead-Acid is roughly 180W/Kg at 25 C
On October 25, 2015, Yusuf S Yusuf wrote:
Hello! what are the apparatus needed for measuring the internal resistance of a battery byimpedence spectroscopy including the procedure. i need the answer very fast BYE!
On September 19, 2015, Kiriakos Triantafillou / ITTSB Blog wrote:
Internal Resistance is a measurement, this measurement must be made by very specific battery Internal Resistance meters. Any one who does pay the price so to get one, he does starting to collect personal experiences with it, regarding all type of battery cells. This presentation is very close to the truth, and my own testing it does prove that too. http://www.ittsb.eu/forum/index.php?topic=966.0
On August 26, 2015, Andre Balogh wrote:
Have worked with batteries over 50 years , strongly agree with Sam comment ( last one June 25 2015 ) have used and tested all chemistry, for military , space and industrial use . -----Resistance does not reveal the state-of-health of a battery and often stays flat with use and aging.-------in my humble opinion , this statement is wrong . The graph displayed only about 20% change of the capacity, like to see a graph showing the impedance a cell being cycled continuously from 100 % down to 10% , a clear impedance change will be evident
On June 25, 2015, Sam wrote:
This idea that resistance remains consistent throughout a cells life is nonsense.
On May 9, 2015, dhanjay kumar wrote:
dear Sir/madam, i m from India , i want to know how to improve a battery operated vehicle ,when not showing ground in vehicle. please guide.
On March 27, 2015, Larry wrote:
Does anyone have idea about which instrument (e.g. AC milliohmmeter, LCR meter, dedicated battery testers like Hioki's BT3536/4560) can measure the AC IR/Z of a battery best? Why? Thanks.
On December 10, 2014, Robert Dierker wrote:
It sure seems Li-Ion battery capacity goes down really fast with the number of cycles. How do they overcome this in hybrid cars?
On November 6, 2014, George Moranian wrote:
Lloyd Johnson How do you determine the correct load for this test? As you state "If you size the current source correctly" How do you determine this? George
On October 30, 2014, Muni sankar Naidu wrote:
Internal resistance values will change with respect to the battery SOC, age, operating tempature etc and hence both IR , impedance and conductance methods and not reliable test methods while comparing with load test..
On November 21, 2013, Karen Priban wrote:
Balancing a lithium battery pack for Electric Vehicle is difficult with large differences between battery cells resistance. I'm looking for a way to measure each cell to purchase batteries with equal resistance. can you give me more information on how to use an ESR meter?
On October 25, 2013, kuldeep wrote:
Lloyd johnson Jones: could u please tell me which method is better for testing VRLA type batteries: a) Impedance Method b) Resistance Method and why???
On October 16, 2013, Jones wrote:
measure internal resistance of 12 volt lead-acid battery 1) get a low beam incandescent (not halogen) sealed beam (*must* be sealed beam for safety!!) auto headlight from an auto junkyard 2) buy 2 digital multimeters (DVM) at Harbor Freight for $2.99 each (they go on sale often) 3) set DVM1 to the 20VDC range and connect it directly across the battery terminals 4) set DVM2 to the 10 amp setting and wire it in series with the headlight. connect this series circuit across the battery terminals 5) the headlight should be illuminated and you should be reading roughly 3 amps on DVM2, and roughly 12 volts on DVM1. 6) wait till the voltage reading on DVM1 stabilizes, and record that voltage and the amps reading on DVM2. 7) disconnect the headlight and immediately read the voltage on DVM1 again. 8) the internal resistance of the battery in ohms is equal to the difference in the two DVM1 voltage readings divided by the DVM2 current reading.
On October 14, 2013, Lloyd Johnson wrote:
I use a 555 timer running at 100 Hz drving a Power Fet with a current source in series as a load. I apply a fixed load and then swich in the current source load at 100 Hz. If you size the current source correctly, the AC voltmeter reads out as 1 mv = 1 milliohm. This method may not conform to the standard methods, but I have confirmed it is an accurate measure of internal impedance. Works equally well on Alkaline, Lead Acid, NIMH, Li-Ion, NiCad.
On October 12, 2013, N M SHETH wrote:
Looyd Johnson your method of testing sounds interesting, can u please explain in detail.
On July 8, 2013, Lloyd Johnson wrote:
I have been measuring battery internal impedance for many years with a simple method. You switch a current source load on the battery on and off at 40-100 Hz. Read the AC voltage on the battery terminals with a regular DVM. Works very well. If you size the current correctly, voltmeter reads out directly in milliohms.
On July 1, 2013, Anil Malapni wrote:
How to test Electrical Resistance for Tubular Bags
On March 20, 2013, Les Springs wrote:
@Bratt and Troy, Troy's method is okay (except that I would use the battery itself as the power source). Charging current decreases at a constant charging voltage because the battery's voltage is increasing (the battery is charging up). When the battery's voltage is close to the charger's voltage, current will be very, very, low (but not zero). It's faster to use a constant-current charger, that increases its voltage until rated volts is attained. A good test of a battery's condition, or internal resistance, is taking the difference between no-load and loaded terminal voltage, divided by the test current. I submit these comments as an electrician, electronics technician, and electrical engineer with two degrees and 45 yrs experience. Use the comments as you see fit, or not.
On December 16, 2012, chandru wrote:
can you tell Do 's and Don’t for tubular batteries?
On November 23, 2012, yuvaraj s wrote:
how will current accuracy of battery analyzeraffects the Li-ion batteries?
On November 14, 2012, bratt wrote:
@Troy Mikkelson: your first method is completely wrong IMO. You cannot use charging current for calculating internal resistance as SoC influences the current the most. During charging the current significantly falls down at the same voltage supplied, so it would indicate that resistance grows up?
On July 29, 2012, Robert wrote:
For the DC method: What value should be used for the 2 currents? Example 10 seconds 0.1 C and then 3 seconds 1 C?
On May 23, 2012, Ans wrote:
Randles model shows the capacitor in the impedence model of battery. can you please tell me why capacitor has been shown in the model, as battery has to supply only DC current. Capacitive reactence phenomenon is present only in AC urrent not in DC current. It will be highly appreciated if you can refer to me with some technical literature regarding this. thanx
On May 11, 2012, saman wrote:
pls tell me how to check short cct of leadd acid battries.
On March 27, 2012, Garth Bowen wrote:
Hello, I just want to send you a note of appreciation in regards to your site. I've been an electrician for over forty years and recently became involved in work on small off-grid gnerator/inverter/battery/P.V. installations and maintenance. I, fortunatly have some background in lead-acid battery service and maintenance but this is over thirty years old and, needless to say, I've needed upgrading. I have found your site to be of immense value in gaining back that ground. Thank you for taking the time and trouble to compile and establish this site.. If you use this note on your site or for any purpose please exclude my last name and e-mail address. Thank you, Garth.
On March 14, 2012, SURYA KUMAR wrote:
Dear sir, I am from India working in Amara raja batteires ltd.,my query is - 1)can we detect any abnormality in the batteries during manufacturing process by using internal resistance meter or conductance meter 2) which method is the best method to verify defect in our internal process 3)we are planning to study internal resistance behaviour on the batteries , pl suggest us the best meter
On November 5, 2011, Troy Mikkelson wrote:
To Measure the internal resistance: Buy a high wattage (10W) precision resistor of low value, say 0.1 ohm. Put the resistor in series with the battery charger + cable and one terminal of resistor, connect battery charger - cable to battery -, connect second terminal of resistor to battery +, (A) Read the voltage across the resistor terminals. (B)Read the voltage across the battery terminals. A) Divide the voltage across the resistor by the value of the resistor (0.1 ohms) to get the exact current flowing into the battery. This value will be used for step B B) Divide the voltage across the battery terminals by the current found in step A. The answer will be roughly (a few percent, of a 70% accurate measurement is pretty good) the internal resistance of the battery. Second Method: Get an ESR Meter (Equivalent Series Resistance) ($100-$300), these are essentially AC Ohmmeters with fixed or variable frequency. Measure resistance of battery (Equivalent Series Resistance) which is a direct reading with no other meters needed. These meters can be used on batteries from AAA to 9V alkaline with very good indication of health as well.
On October 18, 2011, wajid iqbal wrote:
plz inform me the simplest method to measure the internal resistance of lead acid battery ......so i want to do it practically thanks
On September 28, 2011, Kevan wrote:
Ok, so just how can I test the internal resistance of a lead acid battery? I have a standard digital multimeter to use for this task.
On July 29, 2011, Justin wrote:
When you say "The pulse DC load method provides the best indication for a DC application such as driving a motor", are you referring to the two-tier method? Or is there a separte pulss DC load method that is different from the two-tier method? Thanks.
On March 23, 2011, Santiago Lopez wrote:
This article addresses the theory very well, but I was expecting to read something more practical, as applied to lead acid starting batteries. For instance, how can I measure the internal DC resistance of a lead acid battery using only a resistor and a regular 5 amp battery charger?